 TM
TMFusion Max 2.0 is our next-generation fusion model, with stronger capabilities for office work, document analysis, and web development. It selects suitable models step by step in multi-turn agent tasks and combines their different approaches at critical steps.
Across reasoning, terminal work, professional documents, and office questions, Fusion Max 2.0 delivers leading performance on par with GPT-6 Astra and Claude Fable 5.1 at substantially lower task costs. Prices are also lower across the Max and Code families. Sign up and start using Fusion through our self-service platform.
Surpass leading models at 1/6 the cost
Cost is the total cost of all tasks in each evaluation (USD). Average time is measured in minutes per task.
Terminal Bench 4.0*
GDP.pdf
OfficeQA Pro
GPQA Diamond
Terminal Bench v2.1
XBench ScienceQA
* Terminal Bench 4.0 uses the 63-task CPU-only subset. Baselines: GPT-6 Astra (max), Claude Fable 5.1 (max with fallback).
Scores and costs across more models
↖ Upper left is better: higher scores at lower cost.
The dashed line traces the Pareto frontier: the best scores at different costs.
From Max 1.0 to Max 2.0
Three evaluations · compared with Fusion Max 1.0
GPQA Diamond
Max 1.0 94.9% → Max 2.0 95.5%
- Average time (min)−50%
- 10.5
Terminal Bench v2.1
Max 1.0 86.5% → Max 2.0 89.5%
- Average time (min)−40%
- 159
XBench ScienceQA
Max 1.0 78.4% → Max 2.0 79.0%
- Average time (min)−33.3%
- 0.60.4
Generation-to-generation comparisons cover GPQA Diamond, Terminal Bench v2.1, and XBench ScienceQA.
Read scanned tables. Connect evidence across long documents.
Office work often starts with difficult source material: hard-to-read figures in scanned tables, inconsistent reporting versions, or evidence scattered across dozens of PDF pages. These two examples show Fusion reading the data accurately and connecting the evidence to meet more requirements at lower cost.
Read the figures and reconcile definitions across scanned tables
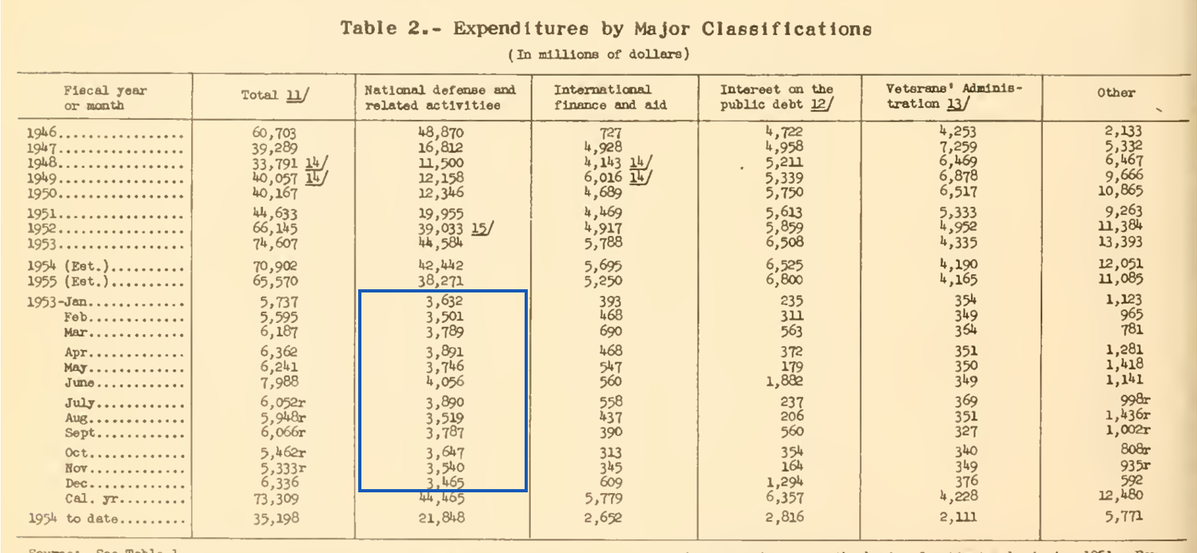
A task from historical bulletins: retrieve tables, verify 24 months of spending, then calculate.
The tables are scanned images. Reading a number is only the start.
- Read ambiguous figures
Dense rows, faint print, and footnotes complicate extraction. Magnify and verify uncertain readings.
- Reconcile versions and definitions
Find monthly figures with the same scope across reports, without omissions or mixed versions.
- Aggregate as requested
Verify all 24 monthly values, then align the price basis and calculate.
See the full question, calculation, and source check
Original question: How much more did the U.S. spend on defense and related activities in 1953 than in 1940? Compare at 1953 prices and answer in millions of dollars.
Convert the 1940 total to 1953 prices
44,463 − 5,321.71 = 39,141.29
Two tables gave January 1953 readings of 3,632 and 3,532. Fusion magnified the printed detail fivefold, then cross-checked other tables.
January spending: 3,632 or 3,532?
Inspect → cross-check → sum 12 months
These are individual evaluation runs illustrating the process and supporting evidence. Aggregate capability and cost results are shown above. The evaluation agent provides file access and tool execution.
Turn a short brief into an interactive webpage
Fusion Max 2.0 generated these two browser games from one-sentence requests. They demonstrate interfaces, interaction logic, and state management, from character selection and upgrades to collisions, levels, and score tracking. Play the generated results below.
ONE-SENTENCE PROMPT
Make a roguelike game
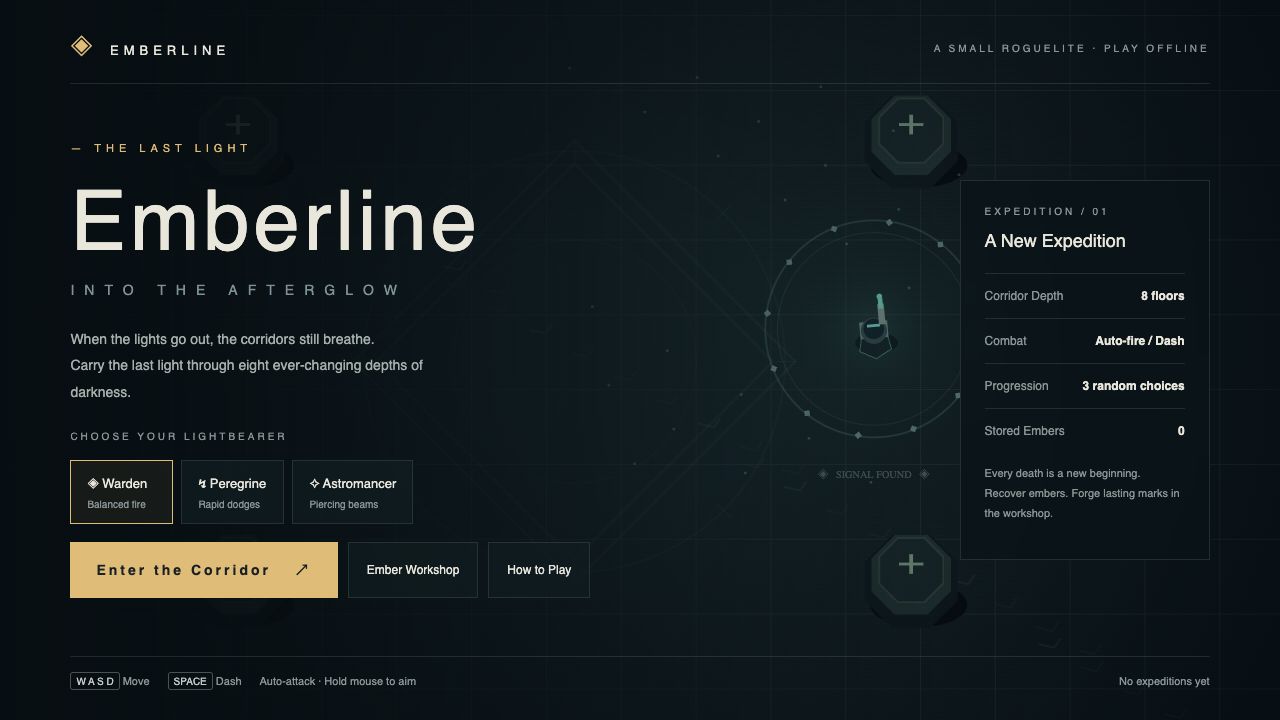
Emberline
Eight floors, three characters, and new blessings as you level up.
A top-down roguelite. Pick one of three light keepers, fight with automatic attacks and evasive dashes, and choose a random blessing when you level up. Spend earned embers on workshop upgrades.
GAME FEATURES
- Three characters and random blessings
- Eight floors and boss encounters
- Workshop progression and builds
- Keyboard and touch controls
Progress is not saved. Closing the demo, switching games, or scrolling past it ends the session.
One fusion model. The strengths of many.
Complex tasks involve multiple rounds of reasoning, tool use, and decisions. The capabilities they need change along the way. Fusion selects a suitable model at each step and combines multiple approaches at critical steps, all through one model API.
Match the model to the task at each step
We study the capabilities of different models through extensive benchmarking and use that knowledge to train our own routing model. Fusion Max 2.0 uses a new generation of this router to make a fresh selection at each step of a multi-turn agent conversation, based on the current task context.
From understanding a request and taking action to interpreting tool results, Fusion matches model strengths to the work as it progresses and allocates computation as needed.
Combine approaches at critical steps
For critical problems that a single model struggles to resolve, Fusion brings in multiple models to analyze and solve the problem from different perspectives, then synthesizes their conclusions into an answer.
Step-by-step model selection and model fusion at critical steps work together in Fusion. You can access both capabilities through a model API in your own applications and agents.
Read the Fusion whitepaper →Lower prices across Max and Code
| Model | Input | Cached input | Output |
|---|---|---|---|
| Fusion Max2.0 / 1.0 | |||
| Fusion Code1.0 |
Each model’s long-context rates apply when input exceeds 200K tokens. Internal model-collaboration tokens are not billed. Token rates and the total cost of a task are different: task cost also depends on input, output, caching, and the number of calls.
See full pricing →Put Fusion to work on your next task
Sign up, try a model in the Playground, or create an API key to connect Fusion to your existing application or agent.
Your application or agent provides file access and tool execution when the task needs them. Enterprise teams can also contact us to discuss workload evaluations and integration requirements.